Stack41 Customer Portal
In 2018 at Stack41, my boss asked me to design a customer portal web application to let our tenants review their computer/network utilization.
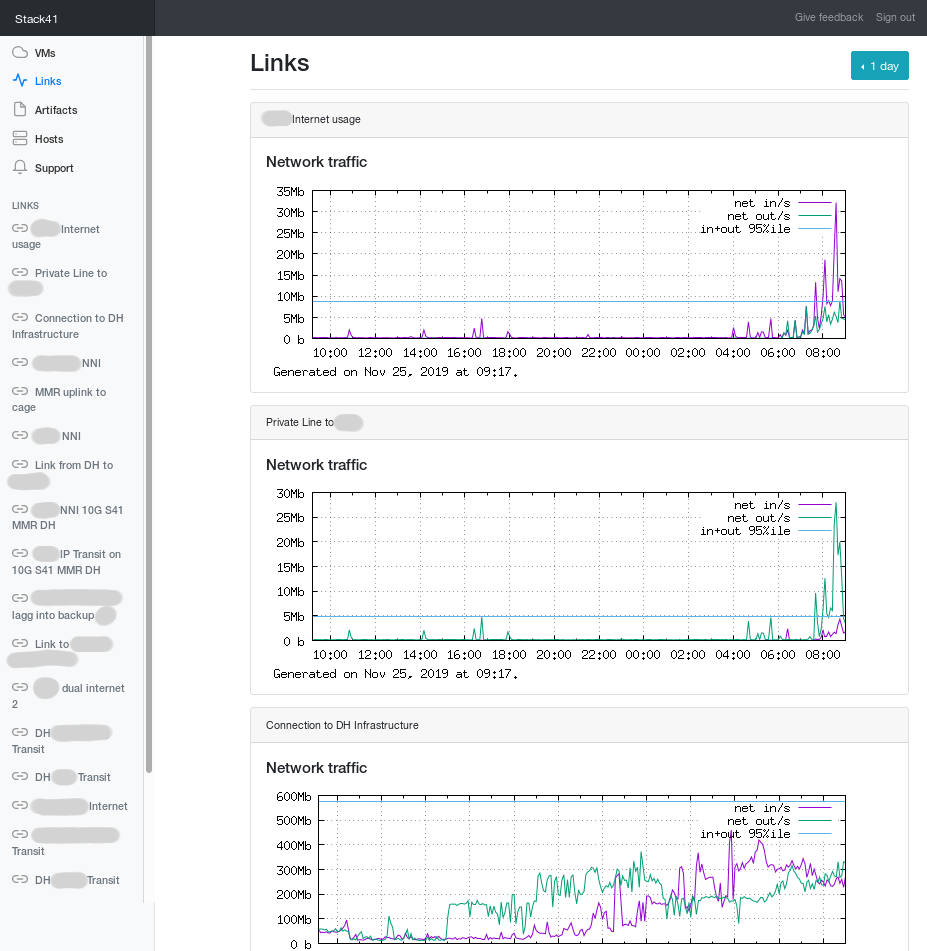
The front-end was written in Python with Flask, with Bootstrap used for layout. A smattering of scripts and cronjobs collected information into a database (shown below). Gnuplot was used for charting. All graphs are charted for 1, 7, 30, and 90-day intervals. Our servers could also upload document archives (like backup logs) for customers to download. The query for Internet traffic was fun, because I liked the math riddle of rollover logic in SQL.
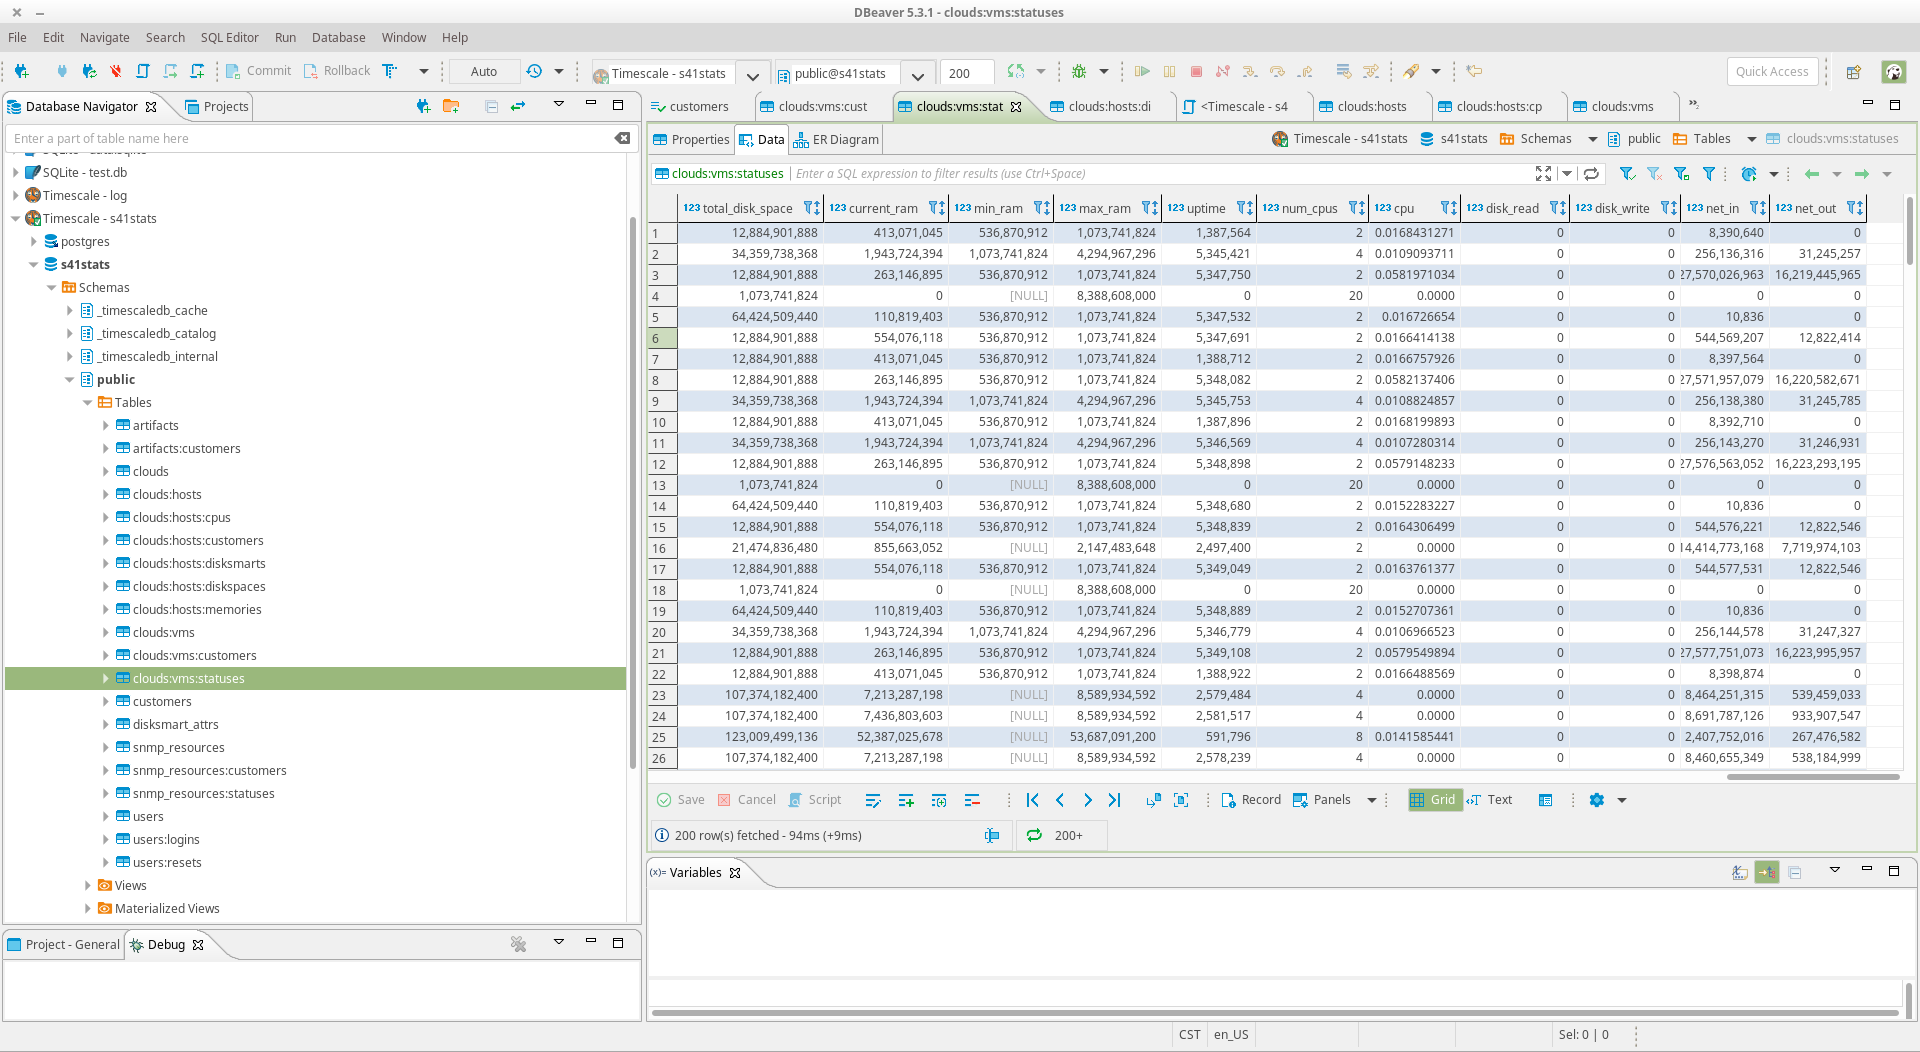
The database was PostgreSQL with TimescaleDB on an OpenBSD VM. I spent lots of time writing scripts to collect information, both active and passive transmission types. There is special information in the database correlating hard drive models with SMART health attributes. From hosts, VMs, switches and other devices, more-ordinary information is also collected: CPU time, memory allocations, mounted disks, network traffic, etc.
