D3vie
D3vie was an interactive data manipulator and visualizer built when I worked at Misix. Written in HTML/JS/SVG/CSS, it is one of the programs I am most proud of, comprising of years of my life. Although the "product" failed, I learned so many valuable lessons about software by making it.
Features
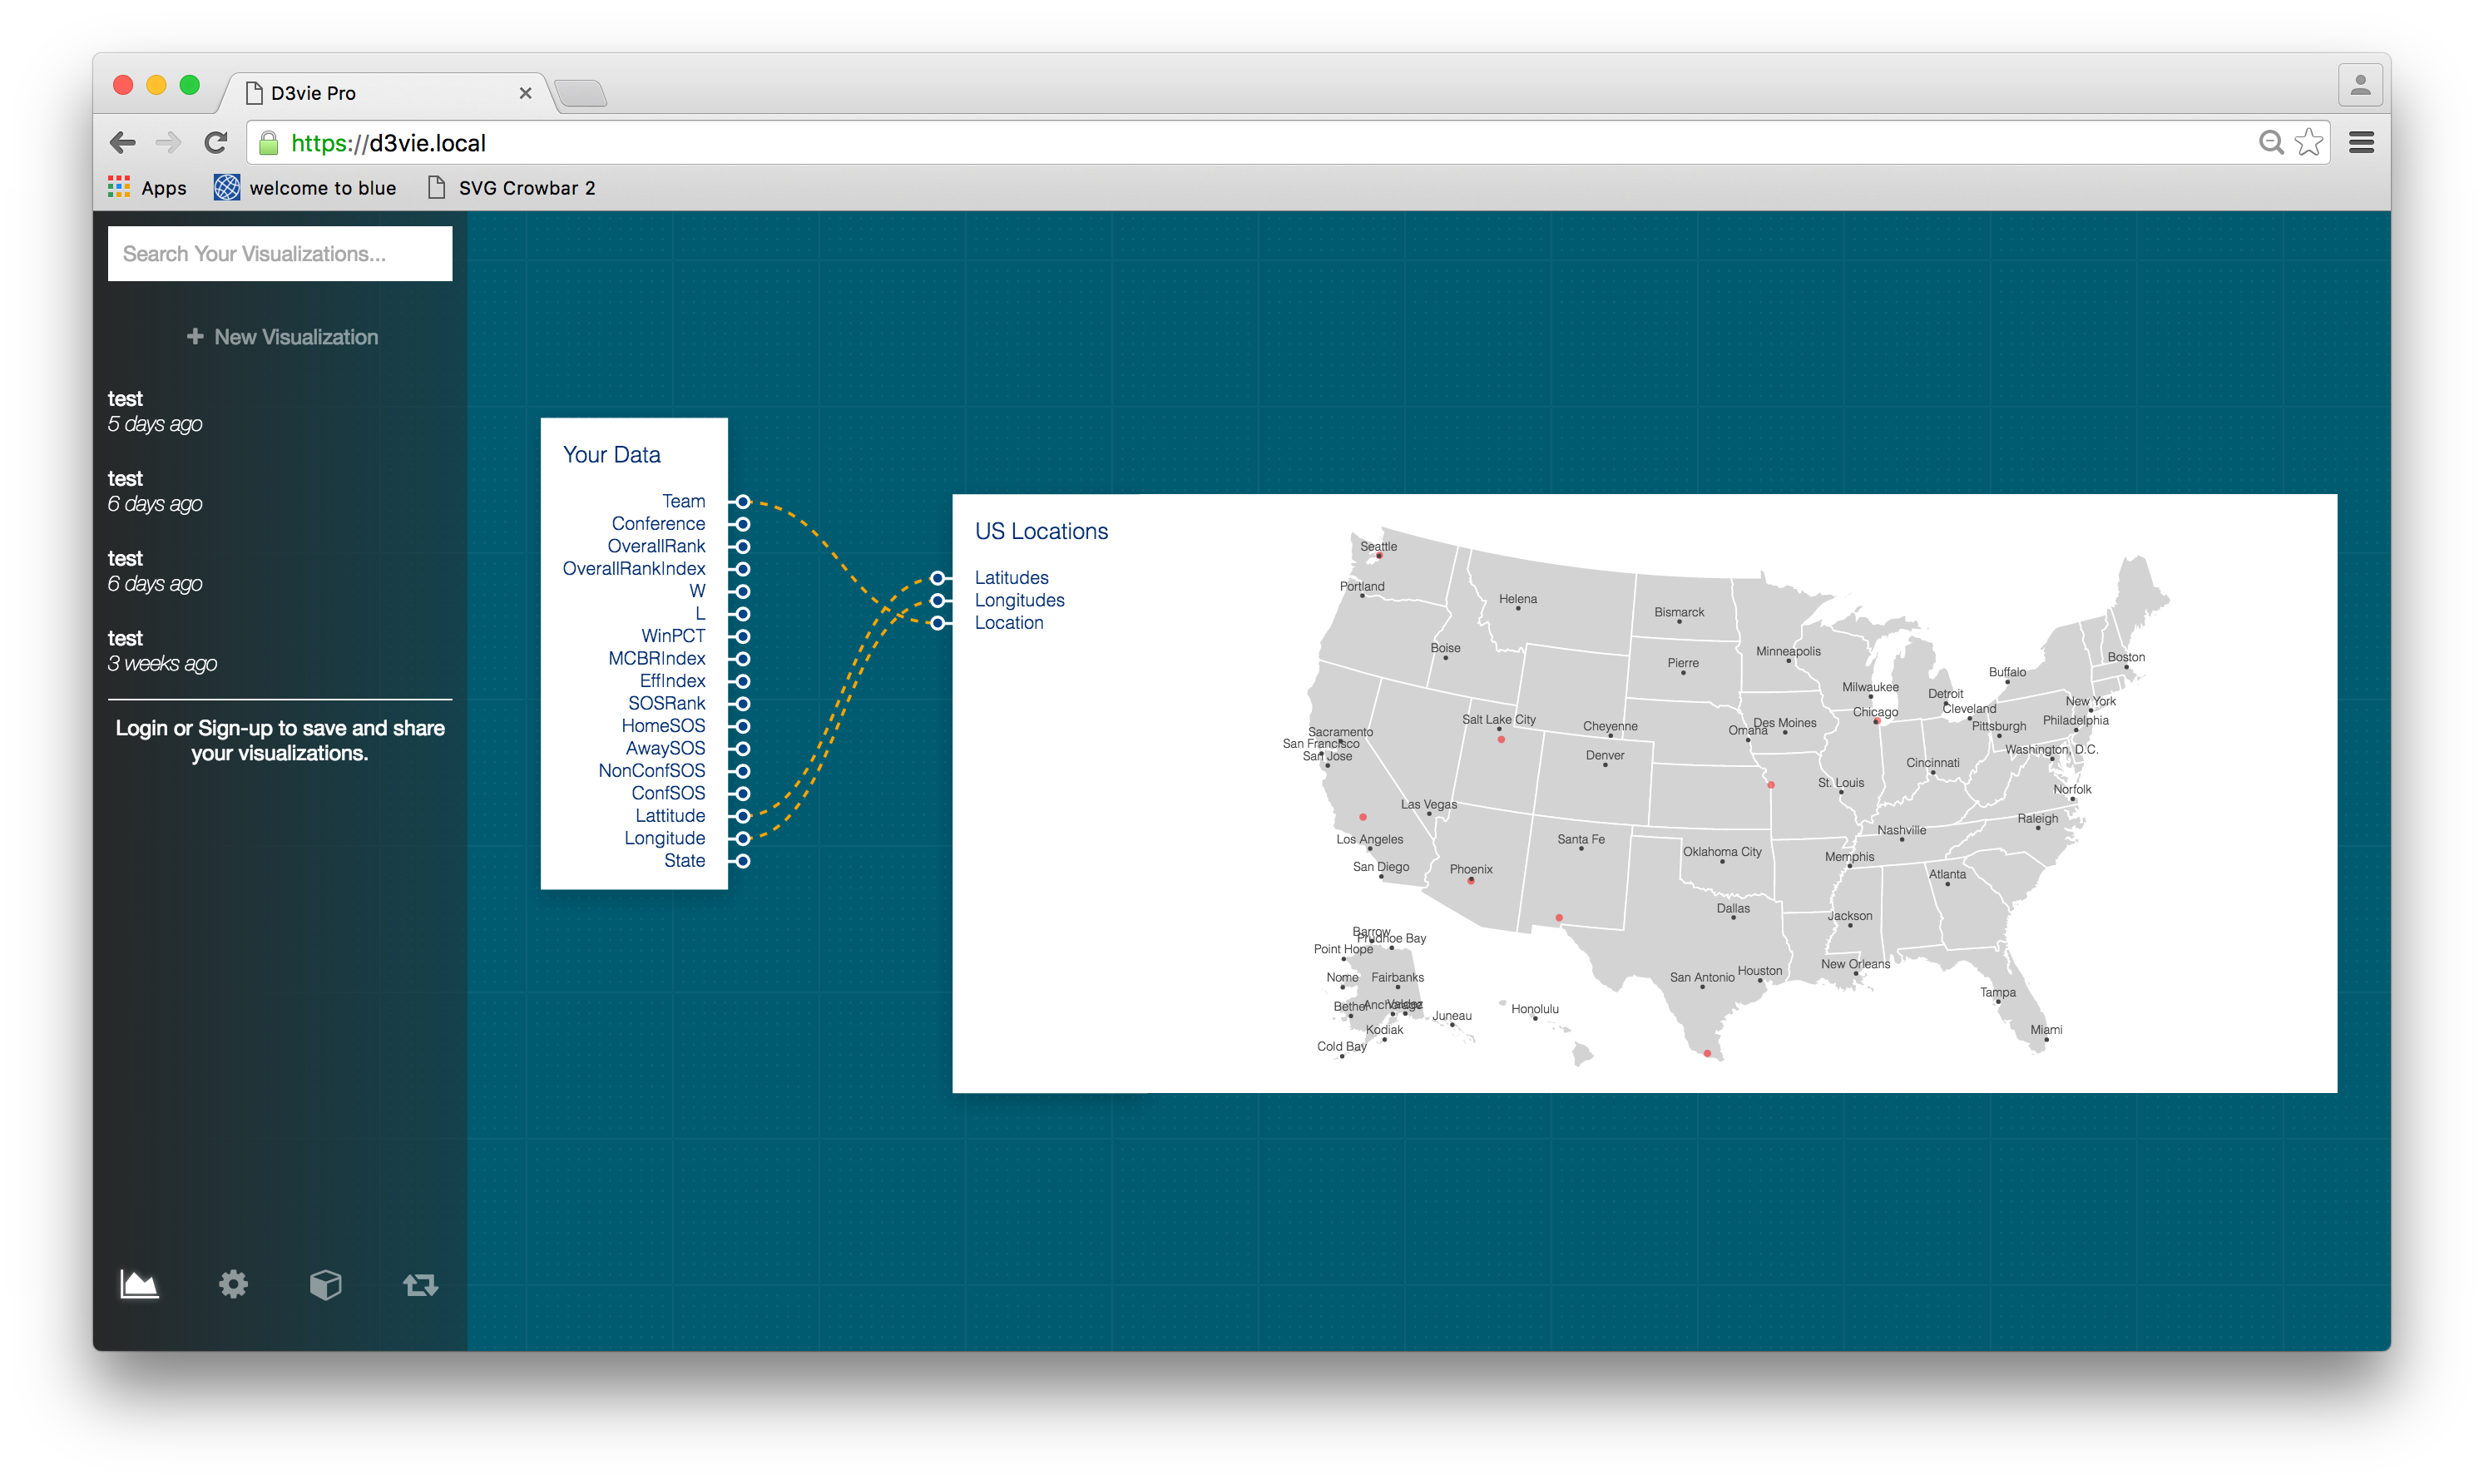
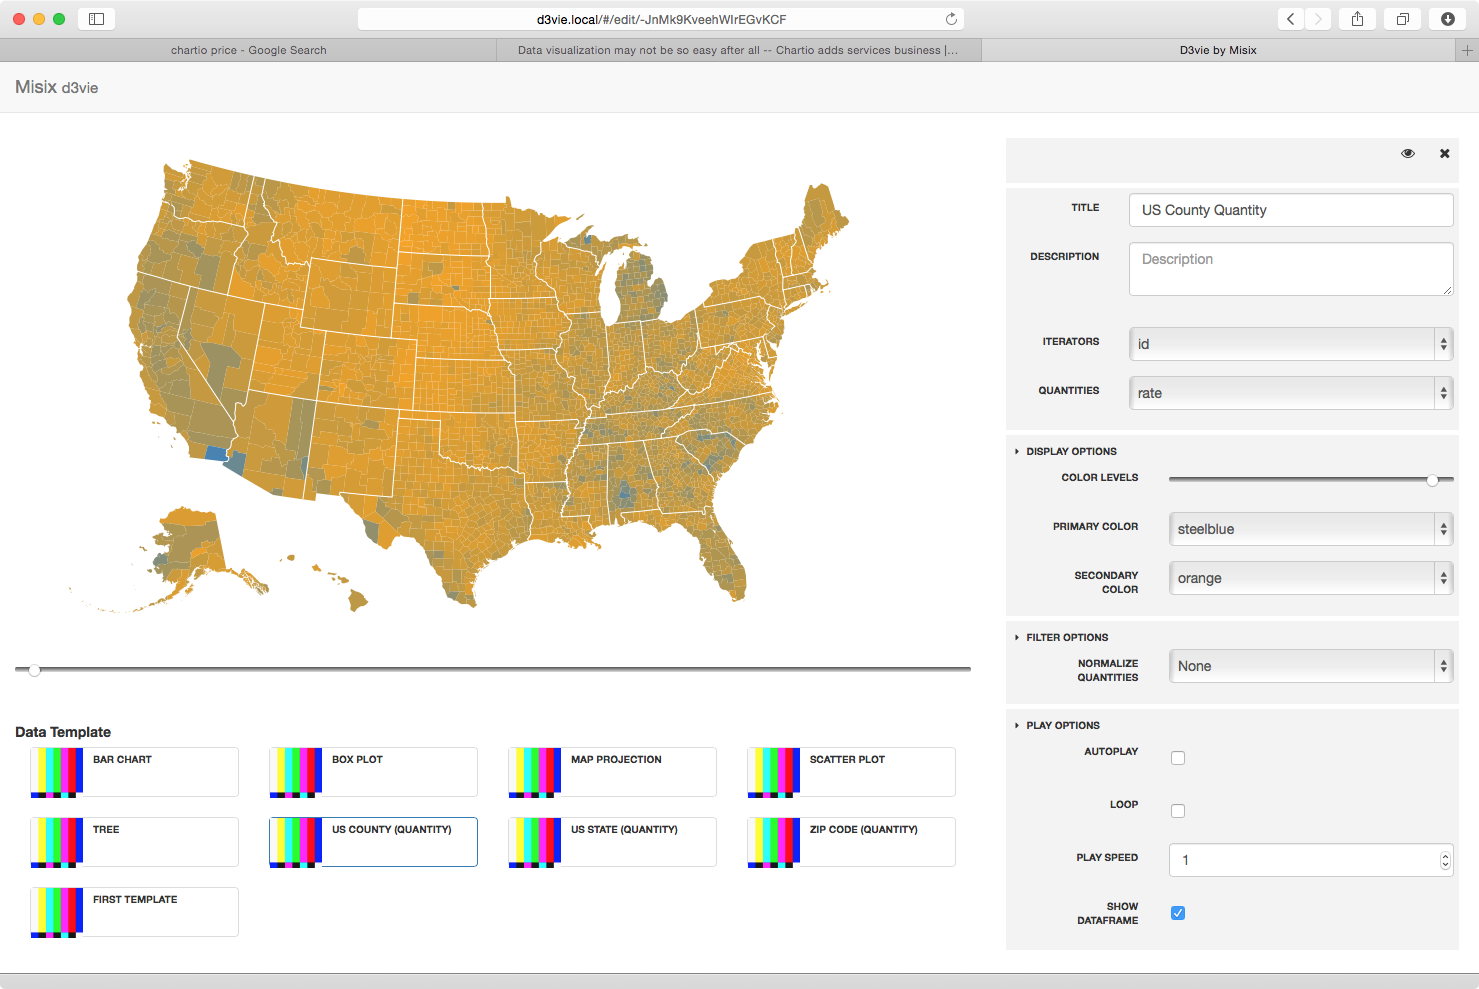
- CSV/TSV data may be dropped into the viewport.
- Data may contain "dataframes," a column that holds an indicator which divide congruent sections, usually across time. This appeared in the final visualization as a playback scrubber.
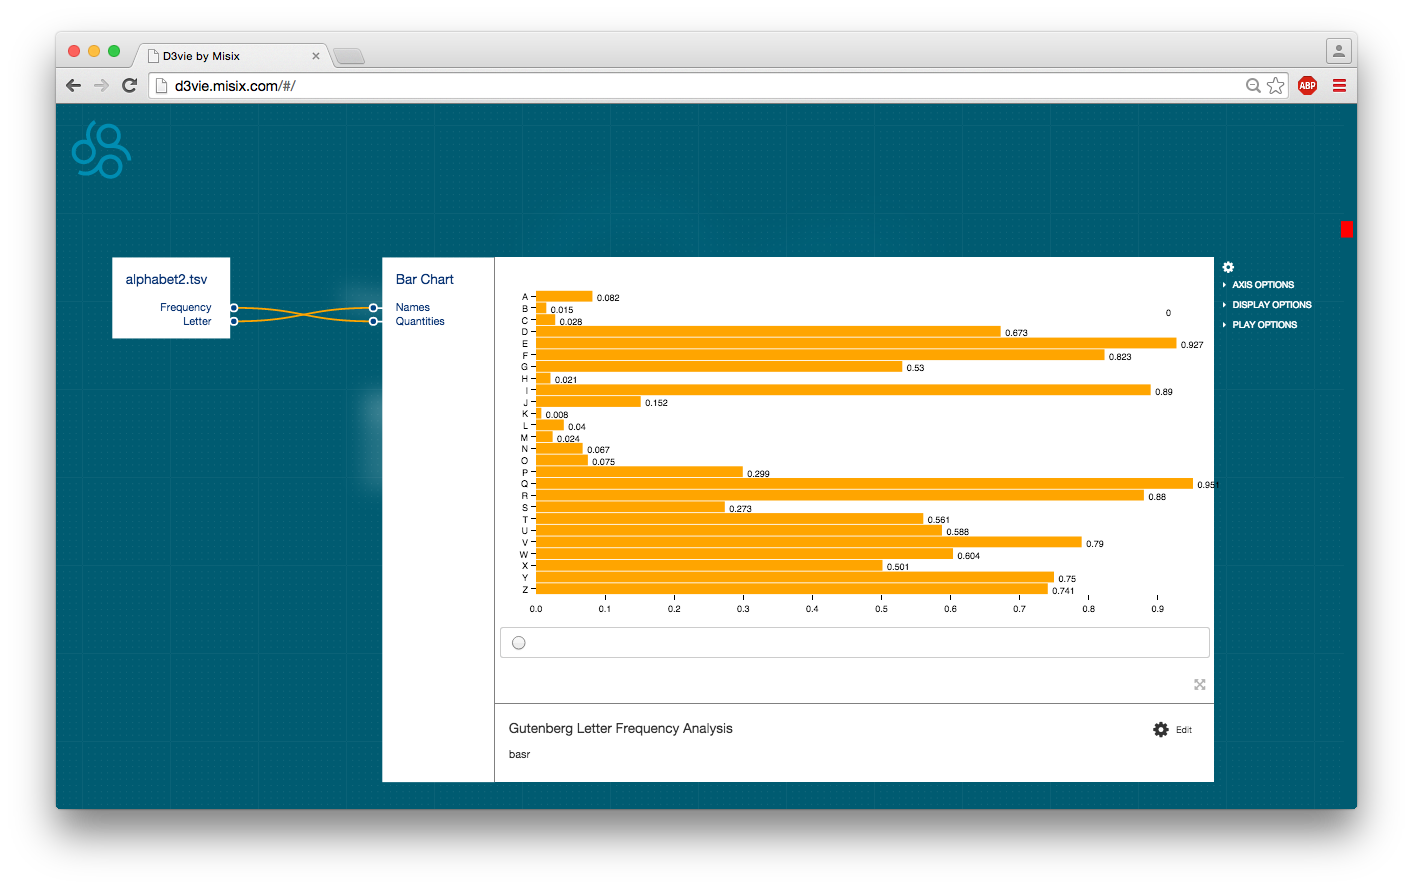
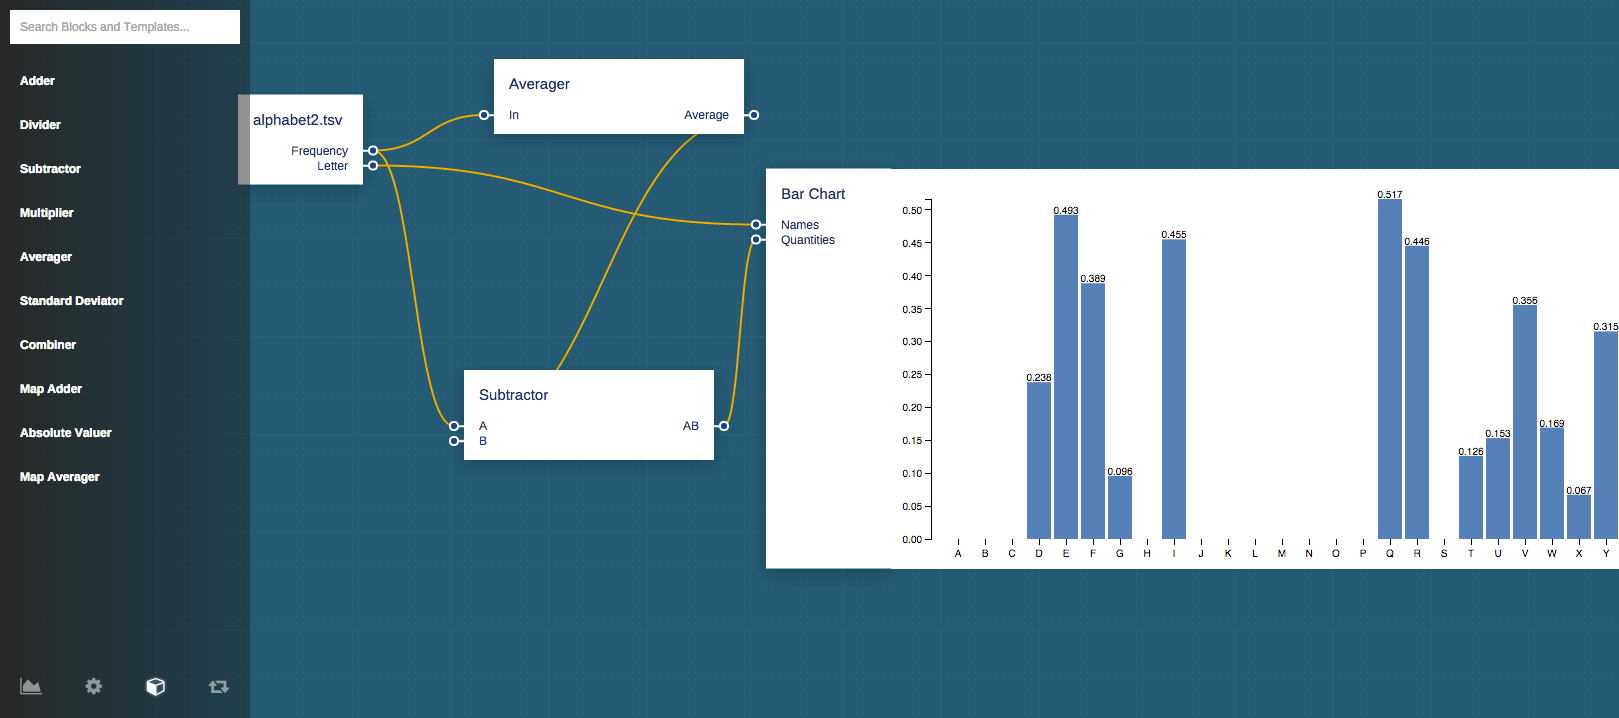
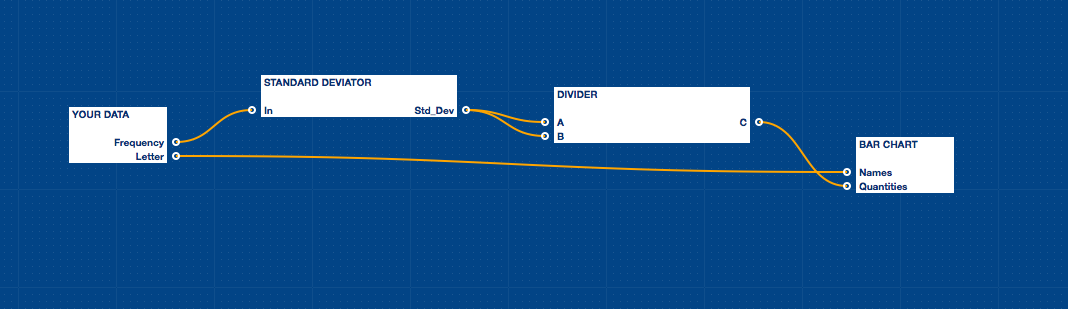
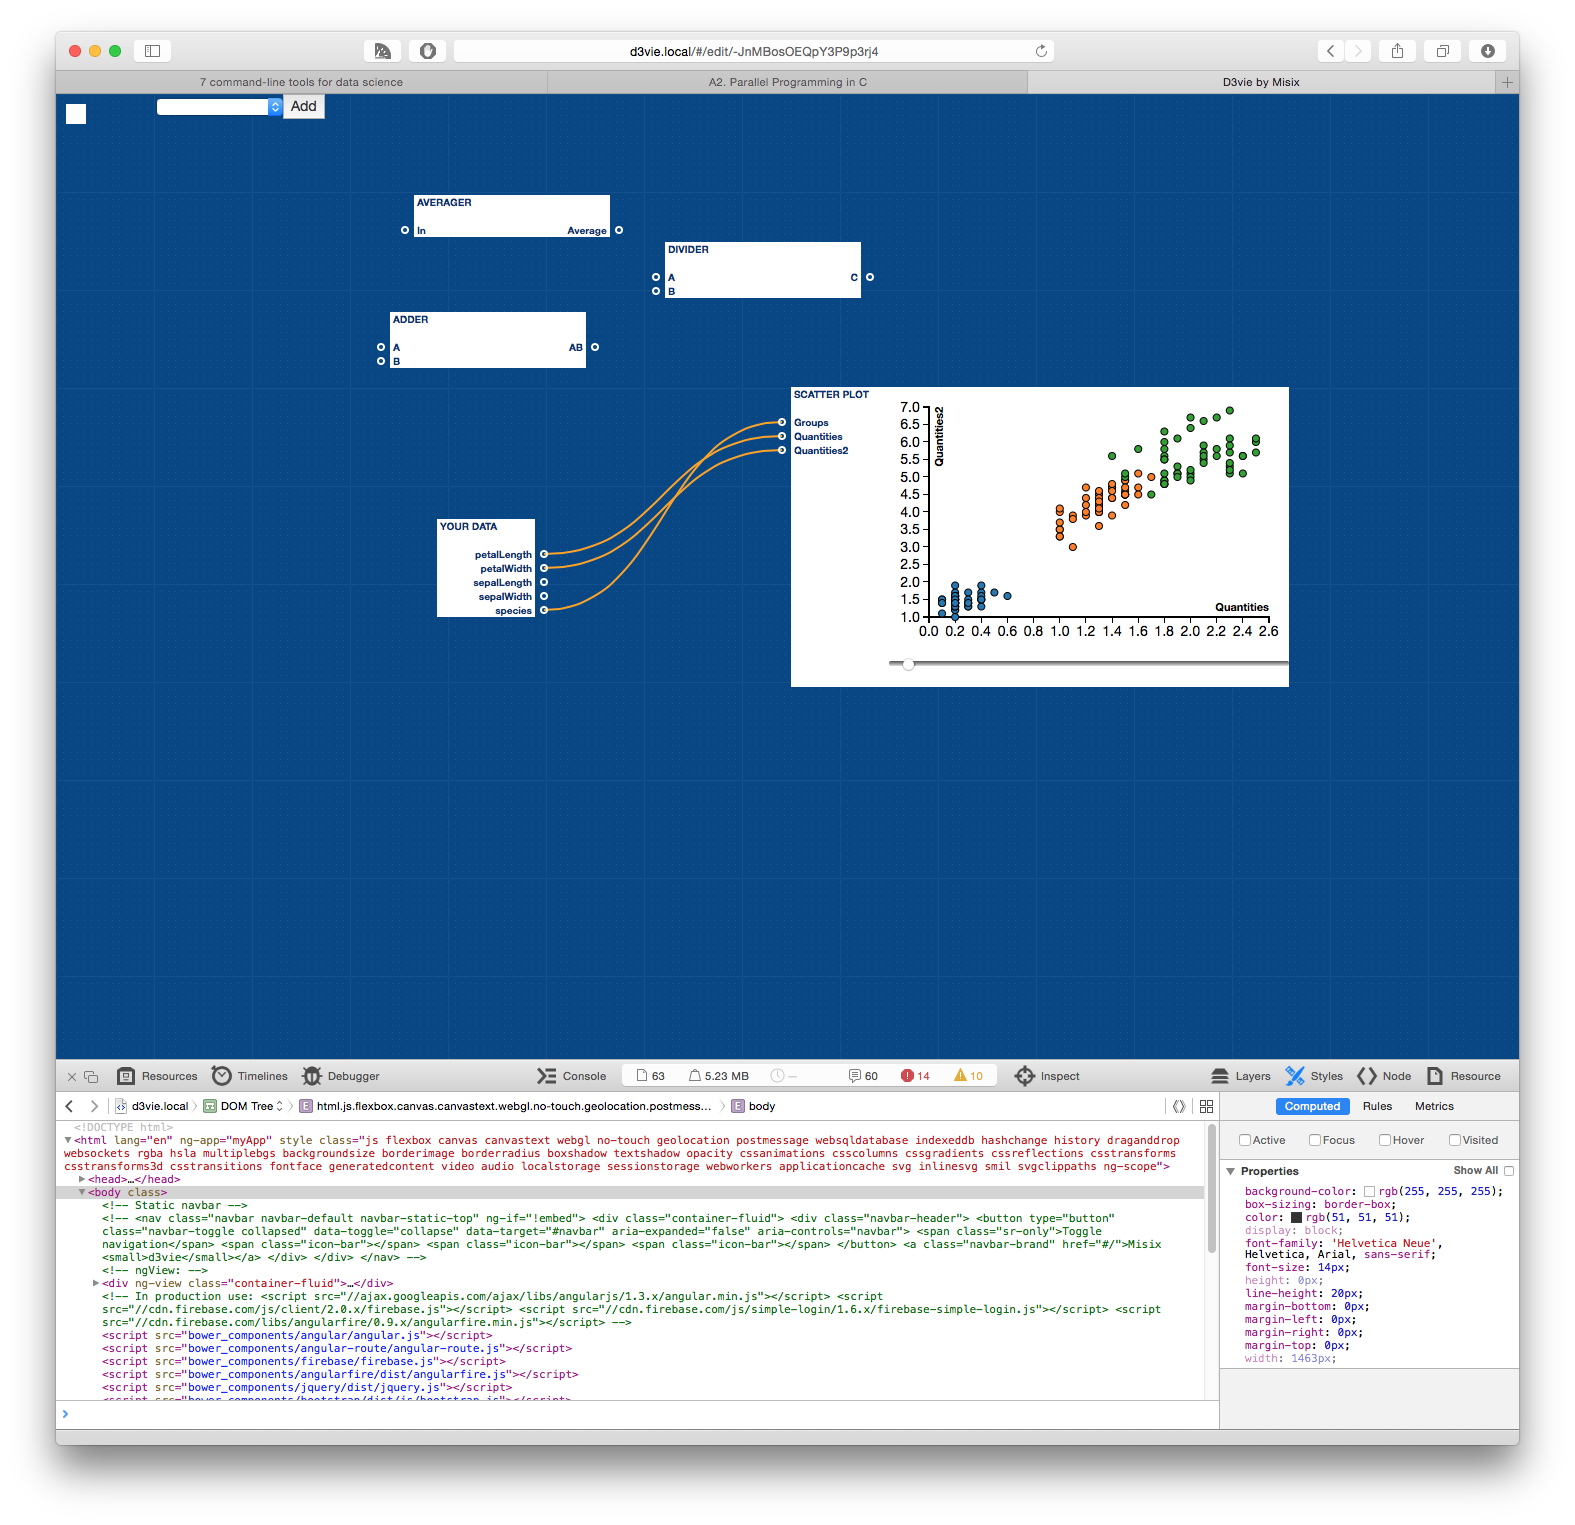
- Draggable "blocks" perform mathematical transformation and mapping functions.
- Computations are carried out in-order of a dataflow graph structure. Outputs and inputs of various levels of blocks may be used together. This was a very fun piece to code.
- All graphics on-screen are SVG and written with event-based JS.
- Four sidebar views (visualizations, contextual settings, block library, and sharing options) that each had live-search from the top input box, even for non-exact text and keywords (e.g. say "math" to get all mathematical functions)
- Later, data was stored on a Misix Cloud server (which I also wrote) and the JS client application supported logins.
- Application telemetry is sent to a Misix Cloud server, which is insanely useful for making it cross-browser. D3vie worked in the latest Firefox, Safari, and Chrom(e/ium).
- Written in ES6, while the build process transpiled to ES5 to retain compatibilty with Firefox
- Throughout its life of development, I presented 5-10 minute demonstrations of D3vie to clients and investors of Misix.
- Visualizations and functions both use a plug-in architecture that dynamically load, and support independent versioning.
- Graphics are rendered using D3.js, which is where D3vie got its name from. Chart templates available online were repurposed.
Design
At one time, the entire D3vie program was written in JavaScript. At other times, efforts were made to bring it online to many users, and that client app disintegrated when I wrote an API for data transfer between the new-client and new-server. The structure of the program was a modified-MVC, adding Services, and was as follows:
- Controllers
- Aide Controller: for visual aides that are displayed on screen
- Dataflow Editor: for drawing and managing the dataflow graph
- Inspector Controller: for visual data inspector that pops over the screen
- Login Controller: for sending the login data to/from the authentication service, and making the login window popup, and blurring the other page contents when the login window is active
- Notification Controller: for the display of notifications
- Sidebar Controller: for sidebar actions
- Managers
- Inspector Manager
- Login Manager
- Notification Manager
- Sidebar Manager
- Services
- Dataflow Processor Service: the brain to the dataflow editor, and handles the logic needed to compute values at each node
- Sidebar Templates Service: the template objects that can be duplicated/used for generating sidebar html
- API Service: an abstraction for all API calls; through this service visualizations, resources, and datasets may be modified
- Authentication Service: for maintaining a current authentication token, and for authenticating all requests
- Block Service: for managing the available data and function blocks, and provides interfaces for sharing them with the Dataflow Editor Controller
- Charting Service: an interface to the charting library, allowing charts to be drawn to the screen into a container
- Node Service: handles communications for accessing data at specific nodes in the dataflow graph
- Search Service: searching for application objects like visualizations and function blocks
- Settings Service: handles everything with application settings
- Validation Service: general object validation, useful toolkit for 3rd-party template developers
- Visualization Service: get/put visualizations from/to the resource server, store visualizations in localStorage, save visualizations, provide methods to access visualizations
Third-Party Development
I designed D3vie in an object-oriented, modular way. So, it is easy to make new visualizations (charts) and blocks (functions). Here is a link to a sample: the Template API, which is the basic way one codes a new chart. This Template API object is given to all Template instances, which are able to make use of the functions exported at the bottom of the clojure.
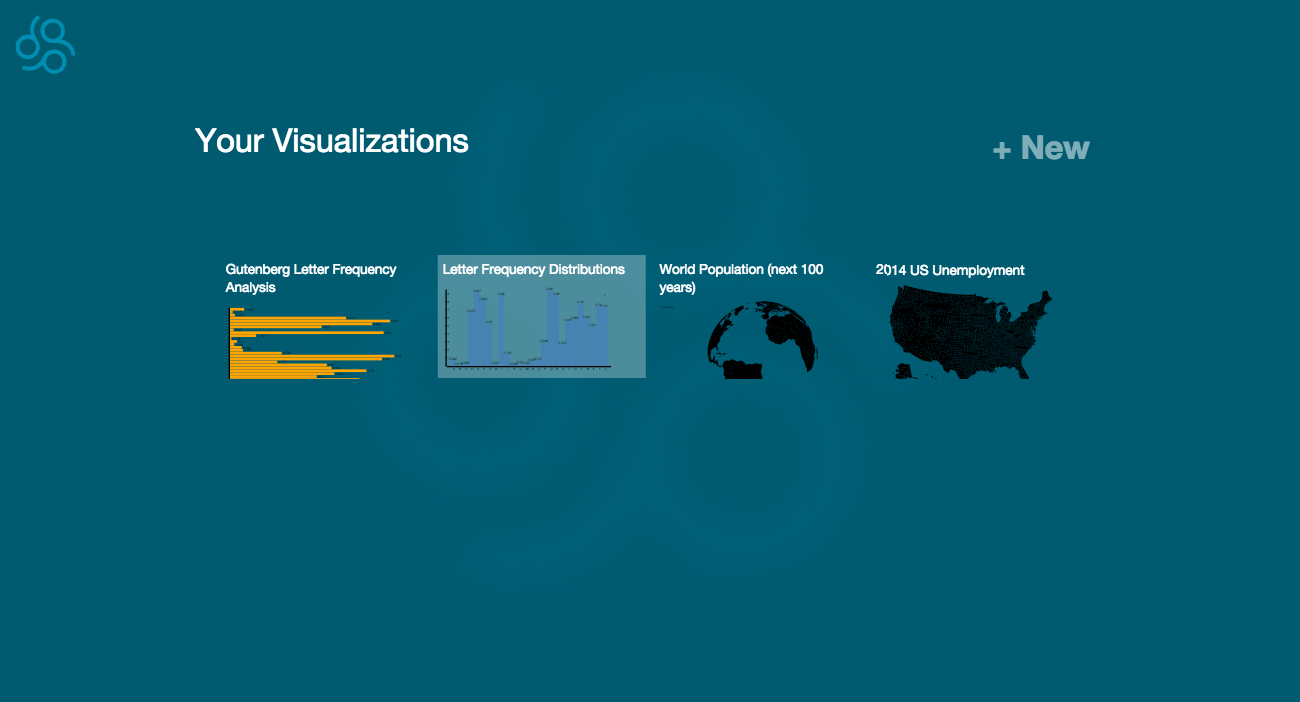
Development screenshots
This was when it was strictly a visualization tool, without a graph editor.
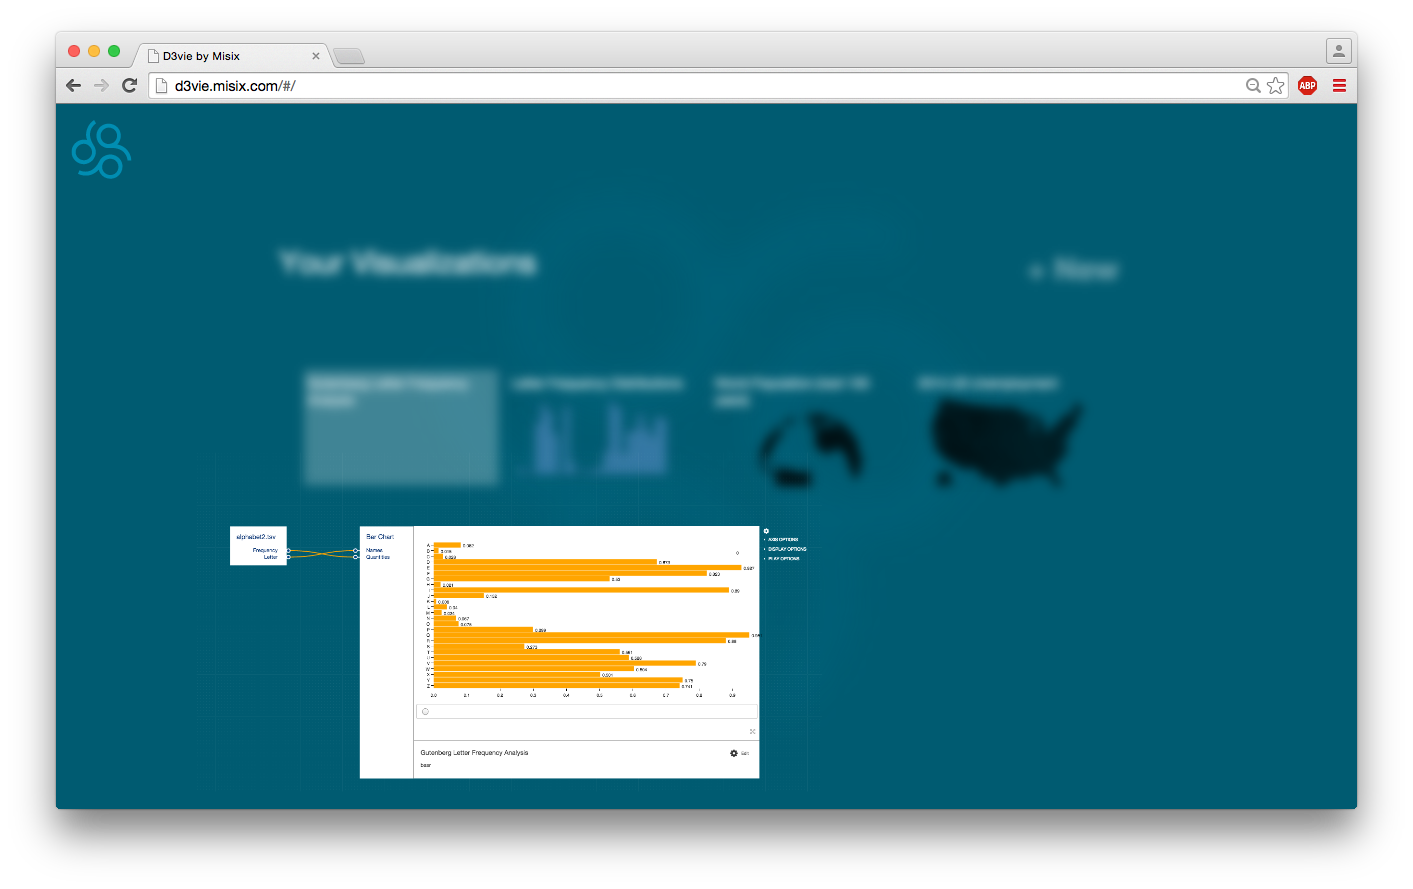
Later, I programmed this editor in SVG.
Eventually, I integrated them together. Claire came up with this design, which was brutal to implement because it captured both a screenshot of the visualization, but also a fade/sweep-up/zoom animation that transitioned between the menu screen and canvas screen.