Bikeshare Analysis
There used to be a site called "misix.io" but it is no longer available. There, a small group of Misix staff wrote blog entries about data analysis. Claire Rutkoske designed the site, and I wrote the theme and many blog posts. One series of posts detailed an analysis about our local bikeshare system, Bublr. I cannot find the original sets of articles I wrote, but allow me to offer the Internet Gods the artifacts below. Here is a draft of an article I wrote that appeared on that site.
This is an example of plotting bubbles over terrain using R. Here is the script used to do it. Please note the time indicator is actually reading in UTC, not local time.
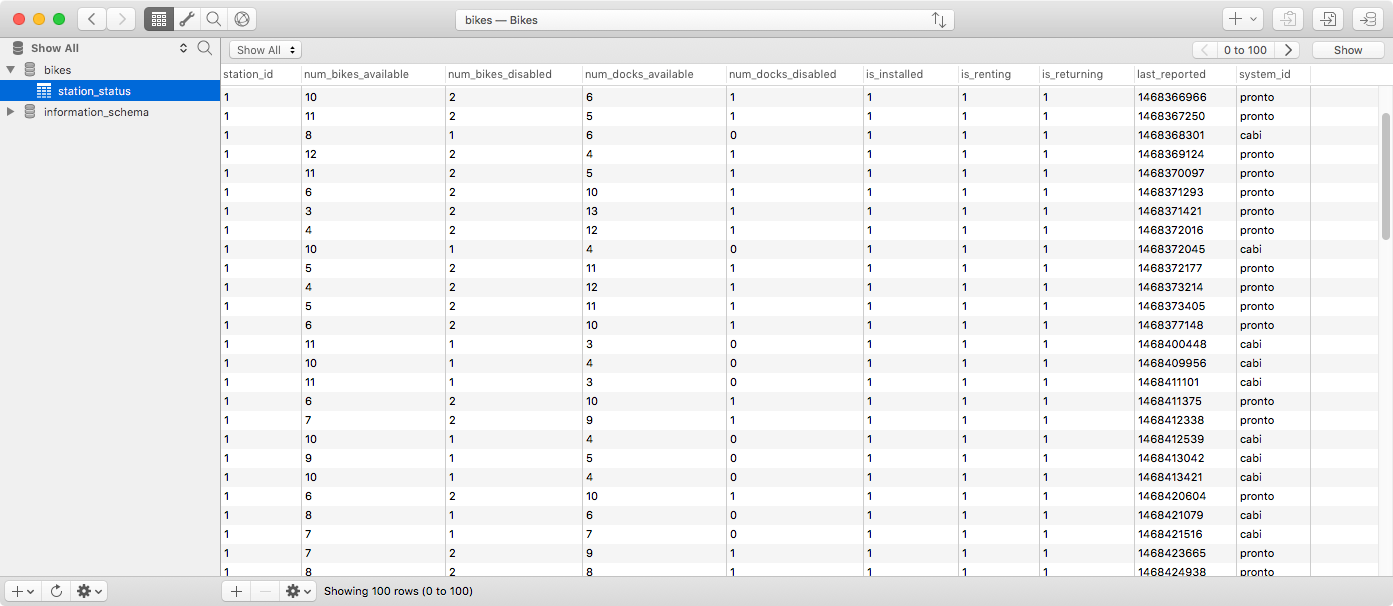
Here is a database that I kept; information was gained through the Bublr GBFS server.
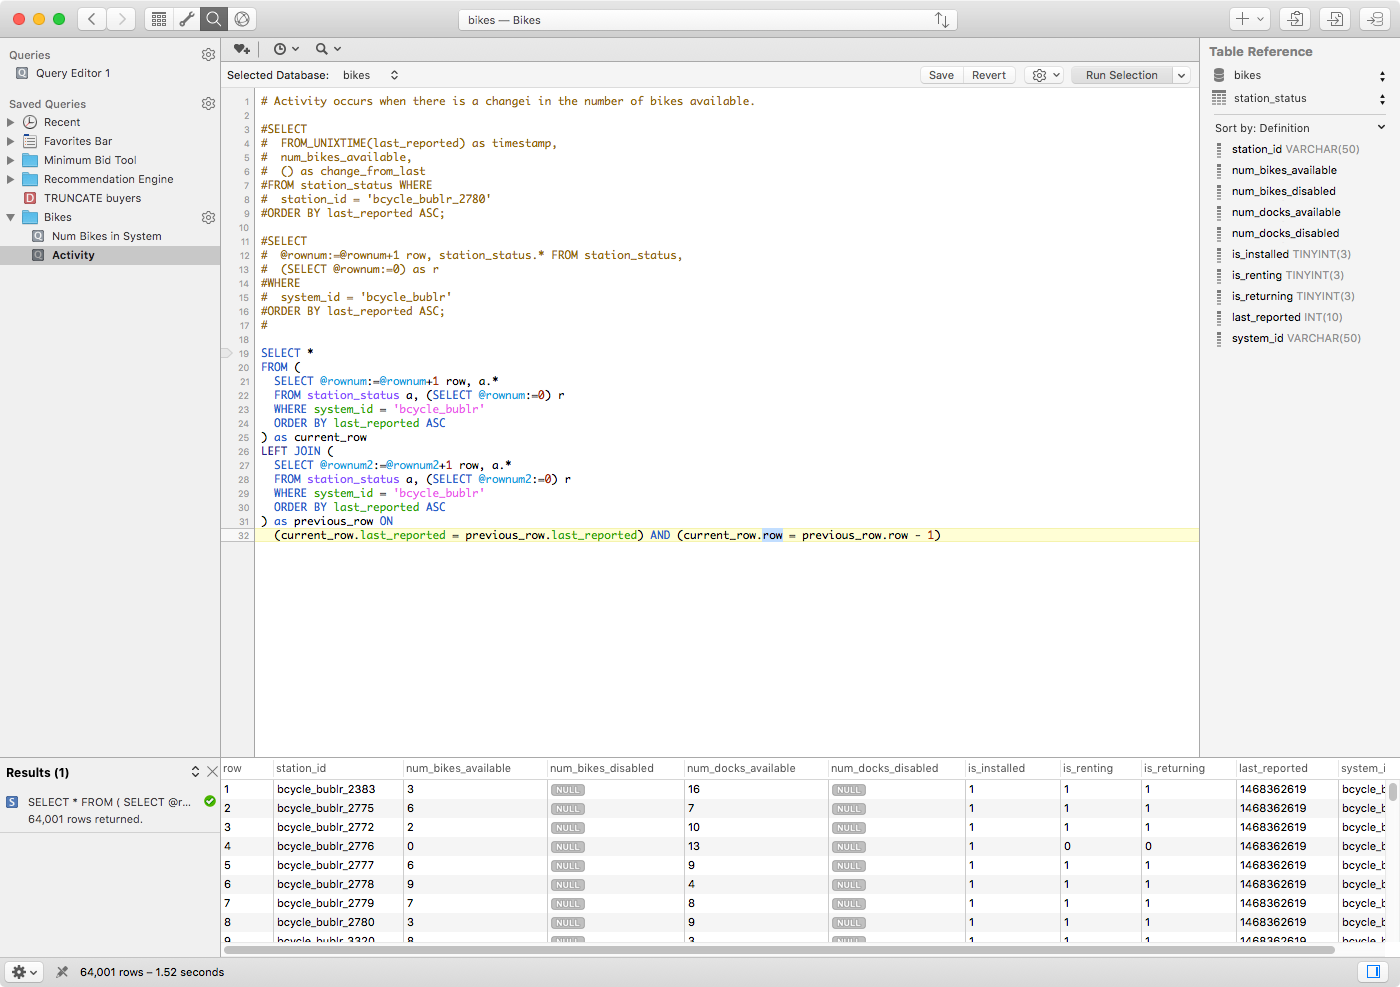
I also made custom tools to analyze ridership. Below is a modification of the SPPE.
